By Cassie Lancellotti-Young
In an era of Ubers and Instacarts, we are accustomed to getting what we need on demand. While this has brought great benefits to our personal lives, this mindset can be counterproductive in business management.
Currently, every technology offers a dashboard purporting “invaluable insights,” but all too often these are simply visualizations of convenient, surface metrics. Relying on these can put a business at risk.
Getting personal
If you are not looking under the hood, you are not getting an accurate depiction of overall program success or identifying where attention is needed.
This is especially true in the case of personalization.
More often than not, when we hear other marketers speak about ROI struggles, it is because they are focused on convenience metrics across the board.
The organizations where personalization is driving long-term, sustained increases in the metrics that matter are the ones which have adopted long-term cohort metrics to get a true view into the impact of customer-centric initiatives.
Dashboards are still used for monitoring campaigns, but that is where the importance of short-term numbers ends.
Start with identifying the ways in which you can – or already do – personalize to develop your own plan for measurement.
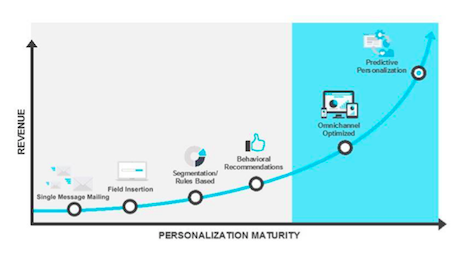
We advise marketers to think about personalization in terms of a maturity curve, with the bottom left of the curve pertaining to the most straightforward elements of personalization (e.g. field insertion of a first name into a subject line) and the top right of the curve focused on the truly Holy Grail for personalization: predictive, cross-channel personalization.
 Personalization maturity curve
When looking at the elements of personalization toward the bottom left of the curve, convenience metrics work.
Consider for example, a retailer that recently dynamically inserted customers’ first names into subject lines. This quick change yielded an immediate 6 percent increase in open rate.
When that same retailer deployed segment-based geo-targeting – so subscribers in San Francisco saw regional-specific content that differed from subscribers in New York – it realized a 127 percent increase in clicks.
In other words, as we move toward the right side of the curve, the impact moves down the funnel and becomes significantly more material.
The challenge, though, comes when we move into the “blue zone” of the curve and more sophisticated programs with dynamic pricing based on individual customer behavior, more advanced recommendation algorithms and cross-channel coordination.
Dotted lines
While campaign-centric metrics such as email open and conversion rates can be useful barometers for some lighter weight personalization tactics, they often yield a dangerous blind side for marketers, particularly when it comes to assessing longer-term strategies such as cross-channel coordination.
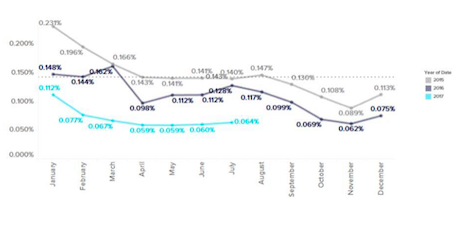
Consider the example below, where we plot a retailer’s year-over-year unsubscribe rates after the retailer introduced first names in subject lines in April 2016 vis-à-vis our retail benchmark (dotted line), which is based on aggregate data from hundreds of retailers.
 Unsubscribe rates after the retailer introduced first names in subject lines
This chart would imply that opt-out rates immediately began to decline after rolling out the subject line personalization in April 2016 and have subsequently improved year over year, that this marketing program now has a healthy unsubscribe rate and by extension, that the personalized subject line tactic effectively mitigated customer churn risk.
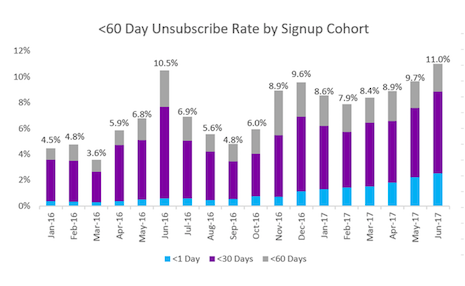
However, the cohort lens tells a very different story.

This chart examines groups of email subscribers based on the month they subscribed and analyzes what fraction subsequently unsubscribe within 1, 30 and 60 days of signup.
When we look at the April 2016 cohort, for example, we observe that almost 6 percent of the email subscribers acquired that month unsubscribed within just 60 days of signing up, despite the campaign-level unsubscribe rate for April 2016 looking quite healthy.
So while the convenience metrics – the campaign metrics at our easy disposal – indicated all was well, the cohort data implies that the retailer has a significant leaky bucket problem, and that in this case, dynamic content in subject lines were insufficient reducing churn on their own.
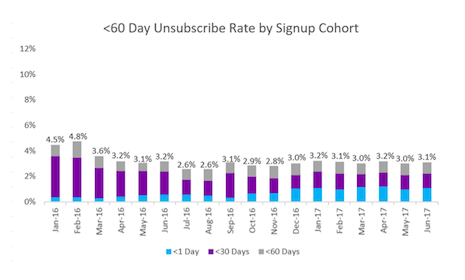
To illustrate why this form of testing is critical when it comes to sophisticated marketing tactics, consider the report below, which shows the same analysis, but after rolling out personalized product recommendations.

In this scenario, we see not only improvement in the campaign-level unsubscribe metrics, but we also see an improved ability to keep new customers better engaged in their first 60 days - success across the board.
Across our client base, we see a 45 percent reduction in opt-outs when marketers personalize the content within the email, so the results above are on trends with our long-term benchmarks.
This cohort view should be applied to all metrics.
The views we find adding most value to our customers include time to first purchase, repeat purchase rates, open rate attrition and opt-outs. The key is to slice the data multiple ways so that you get the full picture, including by both sign-up dates and acquisition source.
This approach keeps marketers honest on the long-term impact of their short-term optimization decisions. Frankly, it is this approach to analytics that really helps to unlock the true ROI of personalization.
WHILE CONVENIENCE metrics may help marketers with day-to-day optimization, it is important to remember that they must be balanced with reality checks from longitudinal cohort data.
Most importantly, as marketers seek to garner extensive internal resources for big cross-functional initiatives such as personalization, it is imperative that they build an appreciation for a long-term business view.
Cassie Lancellotti-Young is chief commercial officer of Sailthru, New York. Reach her at [email protected].
{"ct":"N3ZYH8w2fpVa42znLboKRPek\/07WHte+rZMQBOKXqVsuqIKV+VqVeWypwxMh0zQcKqlqM76SqUpXIzpZh7mQ7RA\/k6EfVmj3PEJhiKZ2A2S1CHRDL2Z8qAkNRySKNRX7iFHZn7dxXpRO1mSa6lXYqP4N7kC4A7+B0O2VjKKMQl2NvRU0rv6Y4bRoSeAqq0Yy1GHbUjnxIp7J5uL2PV46\/RHBeoxkJEdjFNZ0bDQiOb8DQEN8bLCHLXtgZXOoWwmy6AYSzkZHFMyFjZe\/AliEQrNzkn5XaUc0m4IA\/7okP1KK6uXVGmDI38hNFygFxg10KxFTGfR0vaR6b5u3zCUXlcssqxMCRD4ZAxvayqJbpsyGXCssoByw789T6fZ1\/HkXRrG0k0cgoattkfFnJ6voD8CLc1b1pWSIIElr8PWmDxNbUkhy\/efmLDMXqndCn68jAAOyXIvtc0g2a6U5bnPl8dgZXtni6JgZiH5jPWlSc21FfCYSRKLDAEGdfQQ6fLtKTvFJn8PIBL71GcjvWiPxDjFb3DaKMuec5GO0JM3HvVZU7Kaycbl3rVrDePska5XTb80ST0GZbLZ3S0XI6Di7qnsMQpVNQLOKYN7lihBqTVwAmXSFxM+51OTg2LaRgpRstwV9eW52B8gLAnK6lZQ7rZvUE7PyOsZLDVr8R5uvKCiF0GMpkOOHINgR6rThHhvLVFGfV5VgaJ7JZ2syQ4GtsVre8hoW15q305rgpYEZMd\/iVsv5hgEvK9cQM6MZLhXMV60o\/mngmsSKQl7fL6ecgaP3S\/K4c9SjVYLUHe\/PDwh2z6xr4zFE7Tz46j0rFZr\/yXAcmpvvDjnQwUwRqm9+vLtYCDiZe9JyFaB+eEOTO\/4LckQ+kTJPvPz2Weg7W9COHPuG1qLUPv3EppMkL74v0zG9rzVNwBENKA+iNFU5DcoYhkTiEYLbZAdiV9KY+EIufkvBZpUE6IgtlNFjBtJu0nDM9Us+w4aZLqgPEbTL5YgLFgVKVya3RJVPoZoedM9juO8AoxpwZA1kXqjy4yhv8Rg8XqjkHuJ\/MBVqmQOlzNqlqt02WO4pykd4VsEiG2KqBJ8yzi1RXs+whEurR7KfeNu+nwE6chROsN2i7JsX\/zsWJodqna63a\/NM3f1YbOOKZweK7n2gnuy9nWCXuyib0diySfqMzPNhMPaLrexgX1vwlqsZvVokwyENMnqHa1Av3cRXK7zRwnL5+cagP9M6NRPutcxbS7TgU4L\/d5RdebbFOrI4Al4SlVEfsdE\/xmwjtIIOZ2Cdj5JsXd77XaXdkGyYBpHgVkte1e7KuTJtQO2KuUHLaV4KfQzafOIKT70BCJISiJkwY61kYCALY1fACc23wXYB6QXiEvl2UIRljK8dTRCU8U\/BzTussNMn8Dd9NBlSEwQohAl67JXvh5jLgd2LDRJ3QiDLVon550PCq0qdVX3U3bN1huN350QdO\/TOJpCiRqj0TV5D8N7viFenvq9Uq6OMiKfjaOgOip434OhsUNajq8Ol85h3eB7cyEifrxf5GeDonsOQ\/3rDDaEqDNi+kyxLbvLbLj9TTlc8izl3wbW+1O6i6AIIYDl3ySpsBn6dIz1F359LlGvbLKML5BkEIxVSrYD59B0qMvST66BuhxlPuQsdKlUGhWvvV6QuM5l+s3L8SZEcmNqiIJ9wfB7BM9s3rU2V4fQ4RLDWTp\/pq+LOpxZctgN2RgwdEZ52ejhioeLKKDRFkzMh32ZCIvgGf3KhrGjv3pKpehA8nh1JiFgG+hR2q7rHaTBkX9WPdnkou4Ml8zFxG4Ls6+ZykB+7+uivD2kHWYrCz9X8RQEO+4CxzJz2d0KbMz9hNDUAbr1G+GM\/G6srqJOS9kykLQOIfu\/0\/FkzQirCbbnu1XUFhOTSuxHdtqs6pLfYcPNM3zo6XAiN6JUGuLnv8SgMX3lQ5xP\/ZlNjG16XtWu1hsUek9NQe+TMYbfE9qS3xVQXGVmo\/jeYCts2s1e8aloCDT\/y\/DVC8IFlEvV2J80dEvqOft9vqhSz0qEn9LozF16gbUVjRcZGjPqpbN5Q6ID1dIZri+OWKeHhC7cAiq6A67T5dxL1eC+FobqKYcr\/QF5sJIbMeSH\/RbMdrI6s\/n3+zUJLv8aZ20yzEkKjjYFXdcYOewUN\/dNjaXTXbkWE8vFk5Rc9jXcaHRLXLlNnxVnU+cHE28hCf9zlNZy5jx4lGfdHzAyomm2Fjpu0iro1DqivTU4b1t7HlzbVxES7Kmvy5Lap4pcCMa1UHYZR3To8RW2F8DiKq31BSJrCA+tXU3izL9HP0fP\/gHxPM8H577TqWZ6UQI9F68jiaQ4NBf3D1I8N6Vo+BrFMnP8bRM4fx0EXSzK6qbNLLDUigQNug0ZMycaWnyFoJmgwLtOx7RSFmiKkRUe6vvKqD66V6BF+NdwvWQnQuvwYpJ8NzmFSsbjlra8\/qg8bxkMcVx80K\/vDt1Vd5J1wleVDS756aO7Uu2t\/p6f5BqdPQZFdpfqVo0ItsfAEh5itUfMW+TzTouMIexMJqzwsV8u5prLoLwQPZKySBP+cG4CoroEx0AS7pHaalsrukQwG1jirgSj1wM\/\/miYeowvVjw9kjcZygkL2jGj9TIGg49cUyol1KnZnx\/b8gyDZI6WhSpLVrI\/2V+FSshycSQ8kdoUV\/ZE4XoBz4TqPSvbcW9WAV92AxWupRm2OaPcwGLlOz21vcU1nT1y6k\/JQJ9H5nm8j1io7YKkf8GFo2ITIX7vQYk67adh2nGJMNcnkt7Ktc+Kwbgtx\/Q9cCylf15mb3ApVKKKxNM6F+v6sj59rXYCB3ozcxQKe5L30OGRvYnRgKWvPjL9RLsmdTpLCwWNK2i04Utg9ojrv6e8E5Z3JatSWFKsrRMZ70ho5MVxl8EJVwIwqWl6bhKtWpy3onjzjTxZSCShxWyltnDpP6YAUmEjQGMbZXWcFbo2D0ZlY\/mlWjkEPjncOTYXY01vvBgpmti8D6Xeih8QmxkzHeHvDZ\/57QQ2RmIUw5g+HObsns7M30KRw3F\/4cUUVYU+I2KzRxItOn4RGkWAR71T3uZ9Sa3R8sLdIt9igxGvl2\/FigoNznWcx0oTMXrME6R68qqpC3E9BIBRinO2ZKn0Anfty\/FNt+Fe6NCgrKoKyTrPS1Qdv5HKE8KkHvIUbPYWlGUH2zIqdIhM9xssSuscBgCkAFqvDioha\/QMFpzkPAI3Nn2ZGZmoIV+3cR7ro\/IP78kSs+Xm9cA4bwSNXvWbl\/LBl20uOq66qBmgPsZlsT4RYyuFbF7ZnWVxu\/XDQzqhrLQn+CgTvOnTijzVwzAnWSQeeR3NBSNRuoMo3dWRvpEqHYJJKySZ0EkqQBRj5zMTdln0C0pJvmYTENA9eYkvLYGAcDLPXPsBnT0cd2ohKvDXRtAyuG6nO9YZztzOd0utcPUqYI4HaXnOymo+36\/lamsysefB65IQE4BRaGLBe49cKncJakTelyvz93nfTTebZcnpcP5CB6UvpcChRnjJqxx13uOwvxEBl+v0dg1jbVAhk7ESjKzrY1FH7WV1ttKnlM3AMrGpYFQcCkhHm0V\/3c5kTwbMz9MLVemyZebyLLImVL\/TlzdK211tZDPH0t3y1f8UQ7ulnw783z\/l4WtQmcGNNIVbHTvqIpMguiW5bc9tu\/JlI8jXOOD0r+UMI5M\/o9eAiX0KM\/7ebRGWT+K1Uv\/2\/7h4+IF0o6rqOfbDmsm9fylvoG7qc+hN5vo9iVX+eHxJy6qizUaV8hx0QYDWFDG+g+14AhfyFCFxslkjymBXBIh0VxsobKoSt8Jj+7xf3Hkhiim8iVCOn4siy89TtMk3fQKeQSuxzwlbIuC0TkZaOjh6FWjRGg4ieJPRVqxQyxssaDuj0RkT6hIggTbjoXAhvFfD89z09s6\/Li5DLRm4gODC0u\/KUd\/c+jeTG1IAKOlr8MOsTmbcJtdbKExjCaw9tiYQbGpLdNQHZnoOnfmyUPFOYdyebdRQv+EGQpvlEEgRYsuGkKZ6m+pqGaOHjhdDh2jlT8dIevPvNkpsCWopCJQqsnnFHZFCdu55uHarpEWjORhyrd9QU7AYzG1XYsQVFrdptBURT4Q3n8LAxfYV9xn+QiGgWEgLhdiVMtXR5qMKRc0DfoXUYZ4ivPKoI9NLacFSUnKEiRg0KadeCOWJObtGc+Rsm91At1KDSC7Tb8NH6ydbJ8AM+WuzZrDHTBjaVRhwpCvpekZmXmXQiTRCShoawr1yoCGc+4baXQUpsEEajVJjLwPeUD8jKMlxYmqCU53f5yP9Cmnpo9p8yHlFRHZkIb+v+jrpRRqWa2gpXDcRMD+HxSAI8mDcYOiRvxxOSFRY5LHeh+lSm5Qshxoznn5pUf8\/YaEW3tKwdIBenRnmXasZA1WS+pv3RT5wmRu4xtd32PF3M\/auY+a6+3xmUwTuhtSepoRz5C3nlib9LrfOY6lDJGVacS4ny9tfJsPLkcV13XnBDAyG3q\/DBGQgnK+2tmkykUefAYvwEUeNw0tJiFM+O4GMfL3D22wY4rFP2nMsy2+6FS8O8Uu+QhcHhfLfLNObM2\/9dUt+iO+GfXd2V0f7eIneuae9k9ca4HcZhsmiukGg\/aAAReClCNixvHSotkk8BdygzPFScXeMyYpHhaIPIZPwe7WatB9Igad5K1ic1zr3l64SGO\/rAS4CA1WHjESpufB1fujq\/YudGbhC4rsTyelJW7hNn81eVhw6BI2rUzTB2r9sZGpyNvtLvz6AIjg\/LZL3zPTEdswzQtS6ANtJceAkcwz0\/JpzAX68CxGPAh6Hxiagb1pK\/t9HE4uahRObqW7pz1XqM6jUiz4goi40K6ihtPvqiY\/gv1kQHeSXY+aMYPPMXm\/vHEDzNehU5EXjm18pqjJsLKTN\/bfa+0X3p641YYA\/b1VF8MJcjzUAqMx2yXZ+IZi8GcRjKnKbi1aEXLRQPHm0GfJ1irR3PlYqJKUkhA2bPr4DQPsM7sPNz9Q671S9mYOhKXS802bImYipCG6yYILW5yTuSd19m750KJrJV2wPOTAbO22I1BY+nY9y0AxtChCpN8jC3BKyf4d03SxJtSTF5ThPW7uqc2AxQqgTn34EN1wX5PboR\/1GASd459kCuwGPvl4OGg\/XcdFxoLKFX2PW9BvB2xBgW+pMkbNcOBQkUOlJczlFedh9mJu1cT+xRI9yI22ZFKNxppz0fsNpiI0c1IagOpNWPWmVl9ofxhYxLutkxgYhe9\/QC59mZSDkXnbXQZ0MEpHK4EOj\/E3I7hfTwqXq+bBIpBvbzbr5\/RF7Oa6dn01r+gt38khXPXef8eX\/B1mGx8D5YgDlt+z4+YyaW2js2Yl6P7OjBbNs3OAns2OYAdKqkOMhEG+V5T5+S\/UKxsfxyizDnJ5VeMho+HJcDJn+u2EkVRuRLFcucqedeoMkdeDex0c6CjvYJjWQufNcjaerFJgkABH2qQPyBBbHOmcBqOG6Lgs0xLTJHJD1tjJa2k\/mik0IvZ\/CCkAleaou5b\/IW+DCS8B4KvdBDkzC9PQ1v7hYgMcLk3Xm6Yu0IPFUAMFkU1HIK8ynCwArGdb0RBe2Lhg8wf+JXGYynd16XNiTLDKeA+7RtGAhgD0umSu+CnbkNRqKKW3PPeM0J0sJr5n3ziLpneLe4C7P1S\/vTqe2WR5Izhp+5kLpS4VB3OXdDPIsetPtWG421UPDQ0NoRlats7FzmVnfFoYDgtLj5BgLUENvvGZyqMtKzm+qxKSEETZgaBtkDJDx0bxXB\/OjpPlGGVXAfDn\/uNwHhTUhLfEKECKy2FvB6yaOO7Tdh5FaHuZN+Wu5yr4JHBpPCLWztNHjI8KuYtVGK6XGAzF69IQTZ9fZwj1oReDlfiB3M0oBbkz44z8xNVviuy4Z9jr0mVMmEpRkPdxlwsm1w5m3PQKNL+rbTltaGvWKLDn8riLiGw38Gau8cB2Uzpq6lgUCdXYnziV16kQ4gJd1YaYqxjBzUQn8ywslRzdhetja8z+Z0SPvx\/DIoHV8b61mTKYT7qROBxMmr5wfP2HfNcG\/xlEel1\/mQdLJ+bedgpX26k4tLt7gPckYwg5JkEx3ff0jnzCGnaHu9a3t\/E34kg2QASsXfDW2haUt0Sr7pqd\/qTI0pgAj7r7jxSpDHmxh+LFmo+JmAaPNPboDdZHRtIQsyYNRmsnq1BbK0VWth+08Lnj+P2PZ55ILzdFBggBkTVPq3ywNd4Aj6nC7cNChRh\/BFPUD\/sKD6Z3WKI\/3DK70OUEUcdJK1DBLcj61Z06zZSpCuORcIonWGJ7skV2EW6gHoS4XH9\/RmyNytiUiurt\/WfvUFp5WEbQ2dk5BXP0adrkadEE6HW2c88ttZyvmvBfPAalSLgbecsVfsNBNK\/40mMoItC72ifVA94wisehITu\/buZrLWKMnlKmdJH9pbeF94iXWqAQ8lk7EfumkXxvNZXlOn2BzyCykpscS6JSnqkCtLssOdJm3QbFG\/RAUyxLiWxdEBYoIRamYOzJlYEnwZ\/xnyO5bK4FCQOvPsCxfezwCLDQxSzyayrx1ccqIyl9MBc8UMLXVMaG\/2O4xd37OcrqY4Z0kPffZMNIwR3GV+ymcac4Kd\/cEaTlNlN9uz\/MS7h0VkyISGh5xEhASpl87PHSekPGzJIoqzQloONaaq1EjPbXWgfhvn4r8eVzOM8y4vccQAFVYNXX9PxT1YJ7Cr0qqFY0GBXqhxbwtpRqlXJI0hxGc3ST2q9aGerrKwmHyoo2S1yK1XXIrqCPd0CC\/RI6+DewdcN++1QrgkKmzsn6rJWGqtP5OLQXy31dvTni7AkjH7Rerltv+f\/CFhJdlsqSV8qpRTBoE3h\/h1CJhhQw36q6+BqxV+LchzNQb0pezFWhhemG\/57hPk6G4Cndi492acdIwmLrxDHnnVE+yw1Op+nNRWn0dPlePTe5VqgsKDQTjGdGL1iubNQIZBeok3lttOruVc8CmJjtj6HroJ4KQjthurcgM99eVF9Viu1xYKriXkvlzf4rK\/as+xMFqdDBM3QHM0rVpqFZQvFjxjn7ikoD3qzJ\/8A7iw\/GYJjP2yvMB5pViRNYmBt8SElaEi+NT1zJFHisPefPhTQ6oYcFal67wTMs9bG+FxvM+VswPsqaf8QZRJlNaYUc63X7YIfNR5Ypiabl2jR3\/LFMHTnFNIkeRXO52Wb4fggJpITEwiX+3oypFFFS7TCmg9HcPf1BGCRkaoZs\/JIZfylEYgIzBSk9\/f9a3CO4SdJwdTN+Y0wJlUSevqTa+4oi2IR8wrKXZ9nQx5ab02Bywb2BYXFjvpp8kFgnMtOno8F3qeGD\/ojLpsDjR6cIyTTwh8mZbVT9Z7VVbtHuhp6wv4GmyPKvoo300aEGjBcpeTZS1iUg3yO\/7fN29TYZkLSdL0P++QLTIr3WWzAQ3SCoEBLf6AWGNkQZjhbOFN2k6PpeBKDCRz2p6lI+L4bzSEQvCXN8+MK6VdElwZ2cIvlayX935Y1gMvbPBa2pJY4Na287OA35II+LTtNI6i5+ca\/JnCMivy5hdu8KjpW+LwswEZjQvpEwpQi511XMov8tDV68LHIUoCkbuGPTIkO+gvqFUr36ONIqkCTeU6v5FntEqfdlcxoaRzCa\/7kHqGOuld0XD9+bS0fFyAz9CJNX7EaV84+1YVz4Vf33ClYT2zWNVXDlzcVqh1T\/JRFT7QZmYMncC7mG+It1kWQxiMkHn8WM6DjiO8\/w9u1Z3UMRQGZzR3KbNcr1R\/wR1wLPjOFb8TpbysrSJScu+w3kXRZGARLLlsa4R4aFJxvGuCSoV8zFRVrvGC+VtgelIL3RgOMLRu8rv46ZtI+hO1+rfZc69O0kt3YpUMLq7Xd4aTl2HFRPKLccVxV2GxNL9blhFxNXxLvVN7yHj2SJp1u41YF9zJrCqAZUv70bpqhkybOE6bgSJ9p39JoPv\/6BfVyJlqbOsg6\/9RcOsFeqIDzOQS56DJyXmykmeGaevQrSp6DaZGooqYCZyE+6qgXKsDTUvEeDiGiYdyqwgYrBYIOsoyOQcoTT4M1ZQvKKbpfe+dtjY1KSiXsjs\/yBaYN8z4\/mzE3TP576IB7lMdg63t2Xt2cUmgzmLSVci5npBf\/bUOkVMo81GmhEwU+35zaDK6Rqpe3v978HWWGail3EVaD1ZCA1YV0ftgAklf80ipaLu3+AZKk9ibQz3L6m\/7blS3j+7g7axsQbQeXzzaF3NKm07QXE\/rfKjM8YWupFXiYDsmk3blMaFUhxGEtVTHRTH9\/nYB8alJSsUagIJuB9f7qiWlAoIa2\/E2fwgp53Yti34q+0RvdRez2BB1jg8yfQocHk5N9B8TYwMji8e+97kw29y6X0GGWAttk46\/cQco1vqmagFnFiv7g6rd2Bj4FzFwkCczarHhnGFcYVKdkRLGLY18IQmPiMAVbtORUx8QOKKcjzx17GJc0ervYVkhD2SYOFQkkry37Ewwtd+ONFYUwNfpceX9\/sT\/mdy6kVY712aJD4DRm2NsQcdpR6wnc4mhLksZKkyfiJ\/Eln9qQnUSpnj9K2MyHguGJ7cYw6yDuH0GSQ2djpDg\/gcjX2Syrsko3jVqlL5MDdHoZlSfPru\/h9P57xv16VChiql4aNMSeXM+2XUt8SUXxo82XfV7pFsm55BARjdeJSoEDxNi8t3m96P4m03YXp5xTbOujoiSqFF7gvdH9K6dzwT9BzfeRRaabF\/NDzYxslimjIAcejtkIkpNcM0Ys5Ur7UCtx\/1vig6UcVnpzLYlev5LYOUMK9s8w4ZdV3ZrtHykEGUm7v1IrDK5RvdXNNmM4tq1G\/IvaBrK1R+F0SA\/kg7IZrAvRGgnZ\/ArkiuWBH88EcJFj+Ig5OyZfjlU0dhEx5NmUxj7iOvx+ygRsRbgpkabhmNwIGfpfMdhVuIP4UWtTn4f+s6ML7EH57f3EAv8hp3v\/DeaV+ANsieEpx9L+lqcKEFLKzPnGY3IOG+sl3NQ7LMliFpZiVnm0KNXePNFVihwxHqg5my1hc0Xf1lXngOTaklvITfGZLj4mUO4d3UGbuyOjX15+k5\/IgAakf0MBBvcJfRFKRSSTJEjU0stm4AzvqcWrqD7yqNnH332xXb0KuYFZLEEKIw9GCr\/\/+okSnwe8oZ0D3fe3eBzhQ2bGsAfEIzJejWg\/QMkjkQFJpsB9JECgSwVCN7aQXJ2bLHsrNxRfjIDgyeX5lcOVmboBQ2UQvbCQo88RtxmsEzz+Nakoce7YLf36IvNexmgC5qYXtgJtbdQEnDDErJetAyfxKFXhAt1ono3a11XXy+EmLwNwimPKvKASIeJPDT\/++kNb0UvpK+l4i6OzUwJzDBosklpu+HFOwZ9VPBZMBhgLeoLJ+q\/sL2n3qFPcMjuSbHUen5CxkN8gxIPPB6OjswZG8jKsuX5ZD0dDShgolh\/JCgWQulTwDF+E\/y1BQjNul4VLe0r6JNrgKsqVQEsCkL3Ke62BXqDzvA4AFhRFWVy\/8CRqPJ6oK7+zp0mGKCA55vBtNRnJsVp32z5iVTJXZzMzBQchE05y\/rchXAHCUhc85Tw1hgF2viVDTOd7d4wKc6\/PvSFVWivFHFeGS+b0I70zBOE8pYCRzuYUhfF7kw\/TkBfwjEekr05dgwTL6xcnwWtVBoYw1wlSTJwT4SMK8EVF9zeWaTDVockonMm+tpCEXxxeE9OtRQxMT44yMjuYUkgqh\/u0goJGNycPMNOdMpyi26QUrSXZM0FDEOyjXxtdsGyRUolBTzKxX72Gm6yuIg7ILDvvLsMmM8s65QbFXlx1yKZnezMZir9g6UWbx1xhy3LRFfGP8wJowNdjAS6q\/OwKBdV\/HDcZAMcDG\/+AtHxfFX5AUYVlIv3Qa1ocSxnFtCMfh7JJUz9XzSPP42WxNAUo5GNJ77\/hUFAEkbi92tGw3bJzoym8GVLb4xFZvXmM3q0wzoknnr1v5HY7uAQD2FPHJLuvh1mJBLy\/Yv2SSNbB7BIC1HDGn7e75+ADB9p4ckE2ENVoCw828DgXCn2sXSckA8gKZZ7FAls330lfwQ8xI1M++rzoULQjhaUEzvkxynS9D\/wAC5crCxuHuvpsxbHFDfLxy1lJvlqgzrKdOoKgQbVukp5HJVXplRmpplUV8sACq75K1HXxLW9JCjv5W9BPr7dN82o86KQl70fK6WX6EkTYEhrsZgZ7h1+GOMU2aoRdcvoM3Zbuaag5QobQVyMAdLwCsRr7RzTJCvK5Re1xCsKWTrAixh1RXh9yD7QFwVh6+jiilqjFgnp1EL+8kHWhP40bkyyn5cuqKLViJ1yCPPH+IOnlxfvKnlY2djtnXj6Hk+Ke9ISlIvQPAkXyKAJD+tMIG8qRQeEuU5auiMMTkTfw7\/g\/t4QV9jnmf3t6T6X5lbVcOX3ENTPLt0u\/V3c4JZUET9U+25F+T3dVeg6M3O1S+hN0OkQQfnLYNGtRZm9iJOdYSE=","iv":"6725ae57fb60c9a42680cab3e47931a2","s":"ae6a1b8e8990c38d"}

 Cassie Lancellotti-Young is chief commercial officer of Sailthru
 Personalization maturity curve
 Unsubscribe rates after the retailer introduced first names in subject lines
