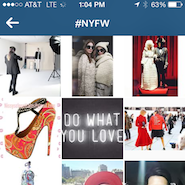
While Instagram still has one of the higher user interaction rates for branded posts, the level of engagement is still down significantly from last year at the same time that more marketers are maintaining a presence on the network, according to new research from Forrester Research.
The research reveals that while brands have been posting an average of 4.9 times per week on Instagram so far this year, up from 3.1 percent last year, the interaction rate dropped to 2.3 percent in 2015 from 4.2 during the same period. The good news is that the interaction rate with branded posts on Facebook is up, likely due to the fact that marketers are paying to promote them to more users, according to the brief, How Top Brands Are Using Facebook, Twitter and Instagram.
“While B2C marketers are becoming more active on social networks, the vast majority of their followers haven’t seemed to notice,” said Nate Elliott, vice president and principal analyst at Forrester Research, as well as co-author of the report.
"In fact, our review of brands’ social profiles found that marketers are doing more work but generating less attention.”
Is anyone there?
A key takeaway from the review of the social network activity of 50 top global brands is that marketing on social networks continues to grow more challenging as the competition grows to grab users’ attention.
The percentage of top brands’ social followers who like, commented on or shared brand posts was already low in 2014 and has fallen significantly so far in 2015 on Instagram, Pinterest, Google + and Twitter.
Interaction only grew significantly on Facebook – 0.22 percent this year, up from 0.07 percent last year – which Forrester is attributing to the fact that more brands are paying to promote their Facebook posts to a larger number of users.
On Pinterest, the interaction rate has dropped to 0.04 percent in 2015, down from 0.1 percent last year. On Google +, 0.04 percent of users are interacting with brand posts this year, down from 0.07 percent last year.
On LinkedIn, the interaction rate is mostly unchanged at around 0.05 percent. On Twitter, user interaction is at 0.027 percent this year, down from 0.035 percent last year.
Social butterflies
Brands increasingly recognize the need to have a presence on social media. The biggest growth in 2015 is on newer social networks, with 88 percent of leading brands now on LinkedIn, up from 60 percent last year, while 84 percent are on Instagram, up from 58 percent.
Google + now attracts 82 percent of brands, up from 64 percent, while Pinterest is used by 58 percent of brands, up from 50 percent.
The leading social networks also continue to attract brands, with 96 percent now on Twitter, up from 94 percent last year, and 90 percent on Facebook, up from 82 percent.
Brands are also more active on social networks, with top brands posting an average of 18.3 times on Twitter each week, up from 17.5 times last year. This is also almost three times more than they post on Facebook, which sees an average of 6.5 posts from each brand per week, barely up from 6.3 last year.
On Pinterest, brands are posting at the same level – 9.9 times per week – while on LinkedIn, the number of posts has dropped to 4.7 per week from 5.7 last year. The activity level on Google+ has barely increased from 3.5 posts per week last year to 3.6 this year.
Following the herd
Follower counts on social networks are skyrocketing, with top brands now averaging 18.1 million Facebook fans each, more than doubling the 8.7 million they could have expected last year.
On Google +, brands now average 1.6 million followers, up from 863,000 while on Twitter, brands can expect 1.5 million followers, up from 812,000. On Instagram, brands now see 1 million followers, up from just 208,000 last year. On Pinterest, they have just 42,000 followers, up from 16,000 and on LinkedIn, there are 726,000 vs. 545,000 in 2014.
Forrester urges marketers to focus on the audience they want to market to first and define the social behaviors of these consumers. Once that is done, marketers can build their strategy.
“We know it’s useful for marketers to benchmark their own social programs against those of leading marketers – that is why we wrote this report,” Mr. Elliott said. “But when you plan your social efforts, you shouldn’t lose sight of an even more important set of data: your audience’s social behaviors and preferences.”
Final Take
Chantal Tode is senior editor on Mobile Marketer, New York
{"ct":"2qTznS+Ne9bkNIMC6WY3UqmEHaNFuy4WZiio9bKj+L0lriapWRMtnJYrd6jtlN47JOzPHs0Fv0VGacl218xHcFQRaDG+zQgSD04hnCGVUFSwp+w1mCQKunWkXibzjjXs01oLkOGDCsqOuYKNGmmOYQZwwIz2R7SUjh8KYi55wV7AodYskN9BvRYwD7+mtWPROTErv0tH2sggRUTHCz3l1zIX9d\/G1+JPm78koc3EOo7v2zUhtU6XdaOYfoUHK7KK7Ud8AvdVLBUTPIiLcYG75UeGfMBroeotHOta5Q5rOFz\/+4pIhUaBt3BmJ+mNKg7fGgsgLPn2JxOorH\/sg4KwMhSvtR8P1aE0Uz0ud+xS0OQVxRJ9kJcuvhiPZsdQFIVj4ehhNjJ7yuR6Tjd7Uvv8QwurTobk6D27e6zu+fGeDMXet6VoVOt5BWhEN7OR6e+ynjhw37DXct4\/H\/sCRJoqmw6+5ygN1KD8WAcgArbzzVH0xzmutPdN18tqjkmasxgjjqvxgu4G+PFNY\/ud47ndNxY\/9mIgbYuhlHov\/cPitsN4IPe0B+huq\/7s4paFbNiJqvdV2Nq9xpDecfILMR+rHG\/Q1rcmLpMUdl29jaxWRGBBGbjEa9FQ4eZD98r33KE3bx6OqyGDDCvi+t\/1bRYvMo8l2DFQSL7EiZX0YnFpxvy+tT0zqVewiLXiiFF84RvEx8LHVTetAaybidWGugWaHChwn\/jlPb8XsjYeRlo\/\/FqP01xwQwG2MZhi4ynmeSVIRVo2JxjSId0N1u7sGXMaRMZrPRQAf7V8Rw7eITDN8I5LiV8LPacxkF7Cxf8Oy2E4I\/oacmiTIQYwn5cZLY3zRDJtzUN0olzBC5AubOVl75s8ONs6oj79xZRBcI9wQn2Weg2ffconKEReSoQzoOBwm92ktpL5ql\/7bprih0pnZ1VKU+nrDABNMKNHElHRWdysHMnEbJE6TIemLDq\/o4VgKgLYRHUDrbza8KeNzWhIWHAVNl5vYo\/bcevmLy765DTPXMesQFDcKWgmuYxvevvp8ItjOMPAml6FyfrYGkirex67vYIIxhM9MB4z5kcnx8\/EyVr\/jFQwLuFDgTWDxaFacETOHIbSaS6Tqq5bUD7z605zJS7Zz+YexyMKro9kjXA+m\/xng3aYTeGKH4WZ8C6+70wZHn826kN3KgjZ2esR8+zSD4eJx1fhcdN87\/v54QHbxgq9YvdCGF5xhyDVhy\/f+xBPvG0BnX89swvxkhUU6lmk+etVJB0oIafxwbfeM0+XNr8Gw1D7yz9Q58I9VC7BCz0OTER3qXs+HCSr0bq\/gotGoGbO1FzshcIf\/yciR6cyOEckCBOMTMPYwCLnDpdW1zFlKkJTQo6\/jacRkk\/KBba8CkWXsB1OKqw55O1C6wz2j5mZWZOz6C+owmAGyioUrb01+fe41cpmyUwxASUeG+vDoDa1ir\/STXhtXS8YZ10ns\/cJguT1zEfmlLuOJBa5\/f0H+0Ro9YiuYVhrE84j5fm4YIl0zNbgxa6AWFKFh3EekZ15ee4mXC7NvYd5XywjPjR9uc8MqQWyxUSZdzOL5NwziIm0nsZm65IGRsQpTq2ALFCndqq+8IbPHTGXjVGUB9wxGy33JduUrhm8RbASY6r+7ECUpa3mHxiD7WvHVvcKeLgVWtjH\/xpgfI2ZDxFxuxvGmXgm86h+HEBmyolAYsBxhwH5HAt7KPCzZGyc7bP6EBU2Fj0x\/yiQ550Eo+6+K9S3L\/nb6ySU2aymG0mff9\/ggtWGmkVLZ3bQCYvP59PXKTtxV8IbU9+xsrWPqv03mVjf7cmgOftw9nFlSvmH5N1QDbcuhAbbszrov5O7UCSYMW1tky62t4jnOL04HC0WVkGl\/4OTd6CI3fha4Dho+wj1YUr8xaPgeGgjIJmiBzf0pryKgFjQOO2yL6OiByqZls5mATfNMZI6FqiNDVNC8WKe3Rr19bmRsW5jN+AJ+CbbSbMAAZ+fSmNwoArCDgAxWWHvXRLK\/lr\/IC7Bm0Zdo9u1BWcxTAODb0V8xVKpxEqp+UBzLQN9m\/ssGfTbknAvEfB0e+\/iwnBMbNeHrUQkx02fmYUe2jx\/gVAcK4lIFFRg009s2Yi\/i1JWxUOHChvqE9rOvSNhD7WQ0QRCmbBVsZ7Vpvl6X7YwoJMBT9N5qtRMDpd14jmCCcZusmjLy+vRnDeViNQk\/W7QxXAPokQ\/WdQlsrb8NLxOmtGyolridqtxuC9zfFw6ExjB4eAljgBEEzi5gfrhimIkI5sgR7KOkqJasEM\/KsZh23XhAIM6qBjFQAP40B2SU8\/GfARjpPtzOOsIVD+dvXWSlqeiFXdA9FbqvoHuCUloWe8dNhysU\/nzpKlOv9fl73vKOi9\/GIuIS7Fb23oqysCy4LX4whDIGUTGGnRYE\/aFHvnbtAHiiqz+F\/c4PdFrUh8d5kbnFFevYSnwMPy\/gUUIqkuh\/WwbgWNcvx9VdRGR4GcSVjmuMZoRMTR2s8a6DfDulyp9yyj0wKIvu7jf3LHo9165SSMd1\/BUd4OrMq4WBEaIu07pEU82IkOOjzKlm6VSFprjvTeAXbppDMIV14oLHUNNIMostxiST++1u2dS7DDbIiGK35SsBJWoO4OYgMR3at9bjLKrJ4uD8D1ehavWl+mYWIzCEavi1\/tAuLFJOqM1NRnvsndXgyNX6UT\/e8+n32BtQPTdr5kixYXkfc4FLKRPRGDC+NHVPnl+EtFEeasbtIXB\/CT4Lx8CWDRAdSHNEXGac5fQg9rhJw2QhIkujqroFy7oAn7iChSfRjQRka9lYAl+Mu9w7YpRCy9yoF\/YzxkPW0K\/r\/azoz6bmT7HlNn5YefIRoFEI6o3NX77+ltU1ZC3AMZoGJfzQiL5XGy9Pvhd372obyAouqYGpARbsYiQhHhJyu\/erwKo5wMzDDY1g4UdYBv5OvdKz3fikV8Q6xLkTlDe7uc2hVwDybEFv6HD4i5a5Lvs4y30XNTm+EYnH5tuESoBov8kQ3aCLmBgTPTLUd7B0rGa8nmnVKre0Suxd5hpz2QCuSf9KQwZ9XWIC8bcSgL0A4fhVPo6tOb8POtMuTrtg\/vjNMadamtAp2h5AUekEkuS3O\/NFjivKpmpyGAGKANmQerkjMthF+NpE5b58yUauEzQagF9uDz+OXkDTuAeQryJTaTLvl01GbljHSJi24KJ8HZT6hr+H41BsTq3l1uMca42MdWoem93pgeOFWJ9KbIwEYU8JALUPfEsWyxe0E8QonBd9wgPM3l\/pICJUZxHT57cHaE8SwRf8hPr1QKEoHN0OVxeD1Wejlq+69fgmf4kXt1c7K87uUaFe6I+\/ExWieZ\/osRNdRYbofZfDBDdTdvCZbb\/PR6P3xcIdot9scvgY1w3rOFTxbvEklQkkWbSwHm3bYpXb7FnEKDkrop85K7Q\/GjPhqVvsMF3EjIY7n9TGWCG0aEjG7\/8lfkzjiKtD9GtXHZLW9iGZf65fiOg175pQRa3KGLFAnpnYmoOl9ro+e96wrtlIwvVXgPd9EclfyOlcXn1mZpmFE5ZFSMoiZ73q0BEGwR6o2k17YzwTai6iC\/6KkYl+jKWIuVlXSQnVboRApPYaoiett4tmegGWMicC\/0+1CYPWr1oPoCeLaZtAp9WI10RSpmeNIM1Su0XVvaF0SPPhsi+y6CadfenJw+yZzWSd\/nllhi4QZpCWM6ct42ep8Zc42mGko93WSxOp5K0v9qKv7kImc\/CPxKQpG8rMOWwnWG9A+XHbf5FrKSI7RNWkMx8pqPhdl9KeNMS0AzN8QZGy5kj60fp23YBVAsf8bAKQFbQqDFF5hVS1yDjtkabSv7zqj8TmyE5195wHWdLgFn1+X8hlsvlxBcuNDerUD53wLDjq6Ir4+aUqZGptDQ8o7NFlX7nanPt04XOuLXFEyUTHYzEPlecGuyP6xVoXoAtjgx\/j90ndYYzRmhAOwVad0P\/SYc+HWuRgeLO\/K6p39ex6i3TyoHOZmf\/zazkoYEaa60clYh04s7MZG3fam8mVMkkSHMh4QAJs7Y6eoNxPvUDkmlZVyNjqwABUDWeVSkRIN3ONhObO\/491+YmhCD7E9UrJVBB0PTB9nW+mzRFycSAYgJdkSgaVw3uaggzV98ijVeSAjpvNjVclKuk+jVThEFYxEwOHgMGvMqnSbRstvcIhrGjt78eqqOC\/7YsTAUK7SNQep3ccTcULe\/eblOTjpZ2rNjq6\/ElKjIJMRTCDOO87Dom4845kqIAx9BWx1ud2xb2AEsM\/5vOMNKchlhxjDMGsWfPbgUzAhMVmixAsL2ZWE59J3p\/RkqTbznmXGAVmKObVg2iJ0VwAsBpTkOjKWK+LxWDy2SHkgcUw\/XxGnmqyiqfUnkculmdie7FabIcGBaBODvjgWVYRZNSMCuw1P4aaURKf\/487MAjU97JO2XP81RetqwqyfZ9VRaVH9P1sXHCVHSjTcwfBmf\/q5KXS8CDSP\/gyJeRSeuMnWIJ99UH7Xn4VqKgz9xhxD+eOQtgxbRSpUwP21OhR3f8s+RQtc7C1twWwtUTN9NBpVORFWbGNMxVfC21Dq\/jyAtNWNNY69r9b4F9CyCYmUTLgH9V0T0fXA32bogBHNlKRCkDnQZS9IPHfntg3ofG0GAY1t2F8gazjQrAIJZ1yY+FAzWMGYcrz0AFdh+bQVyPpXd3HaH5wIKHAuD4lKgb7CUx5y7ZSnbPSf\/4yNvHpQCBBgNHP6FaJEnf5RhtVqfvVUb4e11L1h6vAIe17\/UPhyncnAMKWZcDC5fUAt5deEjdmrvobKawDFjKi2oLB+bLGHfzKsLX0sEzz9pLFodGJpnpBFIySkNLQcCGXZ3c9nbnB9FvqOvhtV0NLzI7e0u0Hx0nNho5i+xYn3s+LCUSuxKQToAFeF6PqTD\/Sep3byq1jtl4I26qRagNm+vRhheqBRFB\/q42+fPQW+mZbQ\/tRvMk9NjeFrw\/AFkakYuHZ0f+KOunSj1vGKIssCejSMlEbckqkVkdtFPtm\/q71RuSsBcSLkbsN2CSs0L9z8kkSi9KRZU7XtYmy71lw2zzke7JvLSH8yCYZV7Y4FjmAa5oz0pDmV02i\/9SAj269QYen+Wg15pAYCZGjBSwhU5AJixdvuJ199qxi82FXqGxF56DdVhxs3iDDZSIS8jajecLM105+7AnHprKktsO0DuMg0tX5AlEQKBjJFrZWv6MFhWPDTsfuyw6CkFWQcisNJ5uTQLY5VjWSCJAiqr3BxrR5is9lQ948EF9\/0y19NYxujpJ8vJt9zBFaeuU9bgBLTuMBuexzRoyx5kPQYOcr3USARVd9YcDRdwyw6EW5Nr\/G4TO437hpkGy8y3UcSDlWut\/VhpPOf+oXoMMZifvCz81nmnIVm\/iqkvjqc7ckFqVAodOJrnsPUBGXAvw9YFsaBxlWp34BvSeSFLl+KdJbtjdqZe3OeLJSuw5LlMZAO54T+Egrp58vjXI8gUmLtnP+hmZcpdBD9BLSYMnfsecPvL0zV2Wi6OT0GVU8SVrgmbjFym3LRJo5Gndti31K0QvPuRyzJbtJb\/Az0izy0QFAykHYKaSjogJXLZZp5TrxOXGfwibHnaeYSFBaL74\/PnaiWXWvjss017hBegWRre4zBU6KefU+Df1RNiku9Su5TDRn2XJ+Xdtfz6b2MvOWf3KJ4njH+lgdNHaD5jFR1JEnhTuf3pCD8KM2xABpOv+9fpwyYTMaorfB+TgJU3oG0Awnca8uRIu7tpYEMsBmZNnB7KV18ydjGI2yoMosT\/yIXZ3peQnfiSOU4xksQjaXJHSz3lQ\/VAQmsb5Wf\/XK+daPh5XNttbDQwkIR+I8ppQdXlZ7iLGbCkeroR5wslNvBKjgT9nZnpvpKRLZnOY7U\/Wlbc\/BkYBsiXOjLltrRM+qUMva8m0ngs31Je445uVJSx5qEQjXB+SxyyjSzch444ZC9GD\/sdxuz+gIVszz1WSVDoamUuWpg2tCnwRDSv5dGyZvyqMMLlncuTpiTnFIDlLtKmqFPvPbXaGoPT8vk9yxtHkzZX0ks2+mvtEfmItk6Ax+6KGKHO+jBFdTGheLh4aFbAiyQ6B8y6\/ndpnN3MJcKDA1VdMaeGeEHObA1UTydfVTjrlvKkBkdKeq5XFAulGOYSDsyi69WKYai1fhAqBiqgIBAi8kiTSOang3kgPvKOI0izqDNYMZAuB6BYlnejFI3xyeUg99Vzcz\/seT7vkbnVijdENFJyfWgSt9gbegeBfzHDEgsap2fC5jksEVQQr5nmPvztZeXWmVzV58dl7PjnDEj\/0z20vXZbvoskeemHGPeM4iHMCg1UwMIT6bvIarr\/Sm4uevBBRi\/jk3QG\/W28zc5q+ERkIxHUe4c4Lk4RfDPomFcYf7RtSvX2dt0Czwm6lC3BnhK1o6MIBqqnQ0LhQrUeUB0PC6C+KstY0l3Eo3efzN1appeUxKvLVdriASiFxvHO2gQiqhorM\/9oMAs6Jcn+cW1G\/yQp\/vZcFwaWIKR4LuBX\/0F4Epw0kH75QBfZCH1KjBnvs1q2YWJ59C+d7smC9wMyMyzGvirZi573dW9VBAxThSqmnT+ZfWDH5MnF39AwEKeH+Kkzs+FKectDlDEVLX2rtlGkgFc1qmnByCqY88yCiAnqC3eQQoz+orrou7b21ityAQcTu1tehsgkUgCf89zZizkB\/7XzF0UHeJ9K\/MFKv","iv":"3ca417f6c413fc96e6205802b2c44a44","s":"15e41995fcdd7f5c"}

 #NYFW has more than 1 million mentions on Instagram